Looking around, I have never seen a foundation or math group offer a robust calculating tool for a pre-algebra skill level. The official solution for pre-algebra students is to become successful post-algebra students. Yet that is where many stop learning, start forgetting, and are disqualified from continuing along other useful avenues. Those students do not need a full spectrum of algebra for their own lives or for a worthwhile exposure to other math subjects (e.g., statistics, probabilities, graphics). They will not be solving linear or quadratic equations, topics that demand much time and generate plenty of confusion. Orderly arithmetic with some special functions is a good goal. Applying known formulas to known values is so much better than ending up disliking math.

T/Maker Five   Email: roizen@ix.netcom.com

pr 
References:
https://en.wikipedia.org/wiki/T/Maker           
https://en.wikipedia.org/wiki/Peter_Roizen        

Sketch from Programmers At Work,    Microsoft Press, (c) 1983

Using a math tool to calculate and compare alternatives leads to better life decisions. Spreadsheets are all based on algebraic equations with parentheses while variable names are grid intersections. The screen is always mercilessly crammed. It's futile for many. T/Maker works with arithmetic and a hand calculator style of notation. It's not a spreadsheet. It's a way to skip that grind. The best path to math competence is to use math. Making that as easy and straightforward as possible from the earliest grade or remedial desire is my hope for T/Maker.


Links for later:  The Download Page      Tutorial Videos      Example Tables
 
The 2023 assessment of 4,600 US adults showed:
The share of Americans scoring at the lowest level (1 out of 5) or below in literacy rose to 28% from 19% in 2017.
And 34% scored at the lowest numeracy level or below, compared to 29% six years prior.
That means that over a quarter of Americans can reliably gauge info only from a simple text,
while more than a third might struggle to perform tasks beyond basic arithmetic.


Short (3:47) Overview Video: Get started with one (index) finger and no prerequisites!


IHA BoxHistory: This product has roots in one I created in 1979 (the good ole days) and a modernization of the most unusual part in 1991.  In 2020 Windows sacrificed these items during an automatic update. Given my history, I was not about to jump ship to a normal spreadsheet. That would be a betrayal of decades of ideas, fond memories, and a surprising level of success. So I decided to resurrect and revamp the calculating capabilities that ignited my fire then, but to do it better for a different purpose.  T/Maker is the only spreadsheet completely driven by arithmetic with no reliance on algebraic formulas. That is worth preserving. Also, this is now done in Oracle's popular java language to cover Windows, Macs, and some machines with other operating systems. With some luck, perhaps I can answer a nagging question that has haunted me since Day One. What is this thing, and what sorts of adults or adolescents would most benefit from working with it?
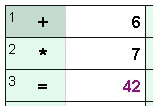
T/Maker: It works with a built-in calculator. This calculator dwarfs the power of the best of the best calculators ever held in anyone's hand. It accepts instructions written in arithmetic across two dimensions. It can save for you and recall any problem you ever gave it. Depending upon your generation, the screen and syntax might remind you of the blackboard, green board, whiteboard, or electronic screen where your 3rd grade teacher displayed multiplication tables. It's where you learned that six times seven was and remains 42.

Calculation Trails:
The unit of work in T/Maker is not a formula like all other spreadsheets but something called a calculation trail.

Travel around the screen while pushing calculator buttons to store/fetch data and calculate with it.
Each trail is put on a separate screen. Trails can be restarted numerous times from different locations.
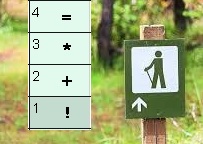
A trail is composed of steps. Steps have numbers to establish the order of calculation.
Each step is located over a cell. That mIght facilitate interactions with the cell or maybe clarify the purpose.
A trail, unlike a formula, can calculate and place many values anywhere in the grid from anywhere else.
With a bit of experience, trails can be read left to right with the same ease (but greater thrills) than Dick and Jane books.
You won't be needing the skin of your teeth, the seat of your pants, or a wing and a prayer for basic math manipulations.

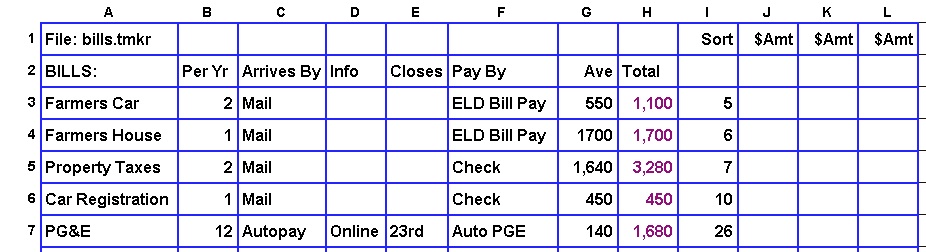
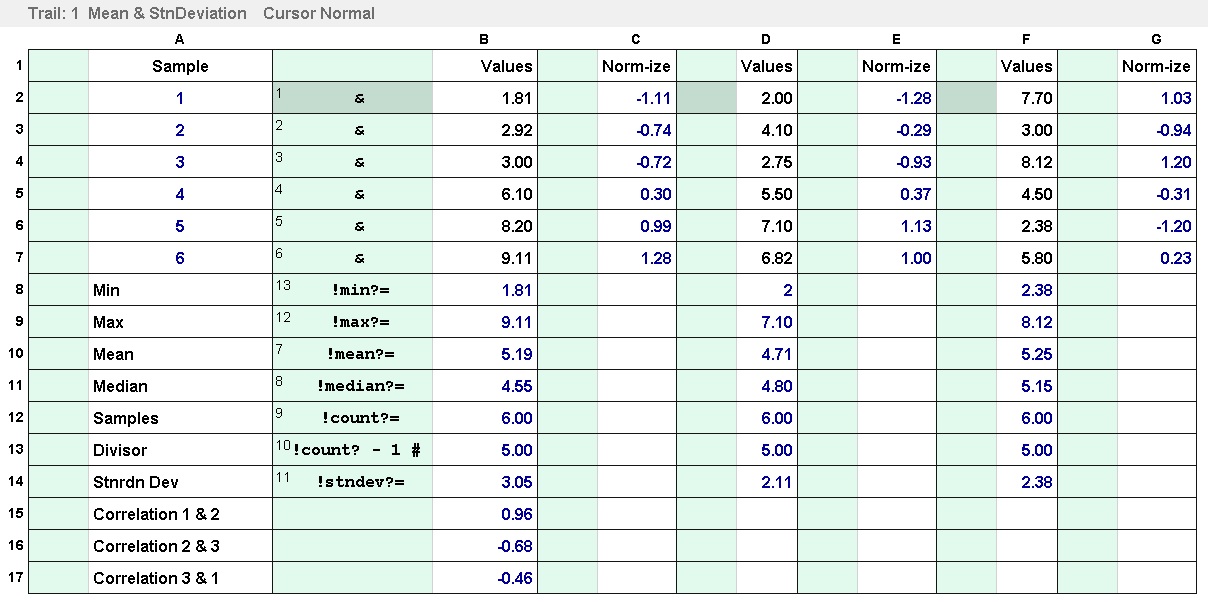
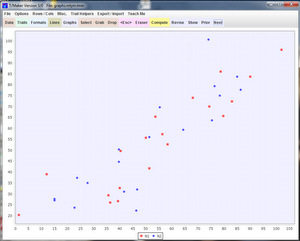
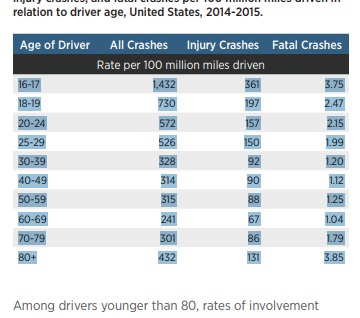
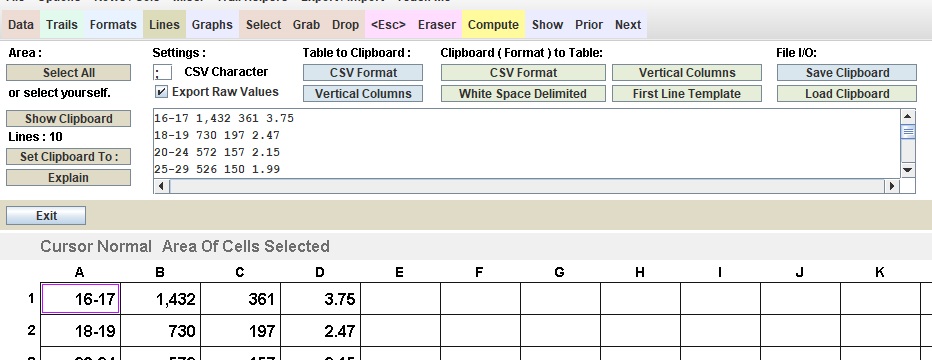
Newsworthy Example: Here is a calculation in the news recently. Columns A through F were obtained from the NY Times.
Column G is calculated by T/Maker using the known formula but without rounding to whole numbers.


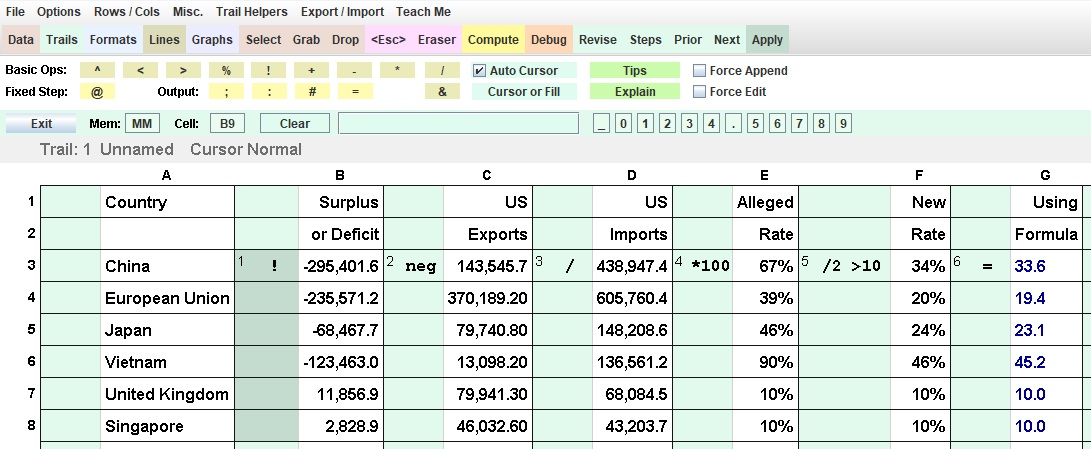
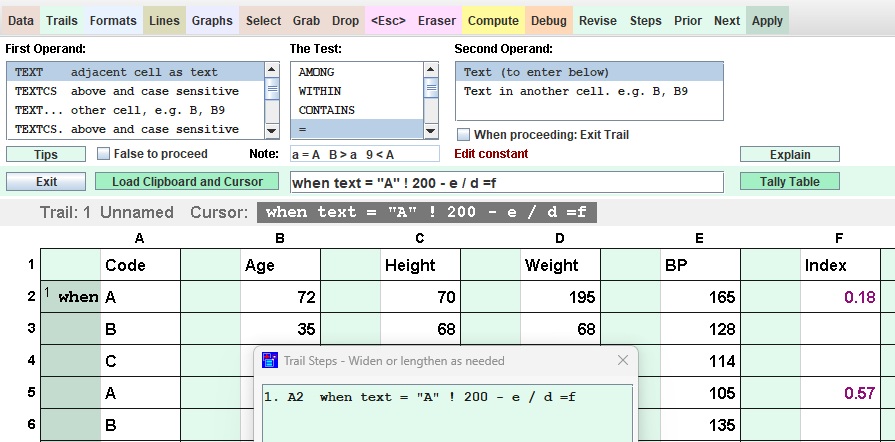
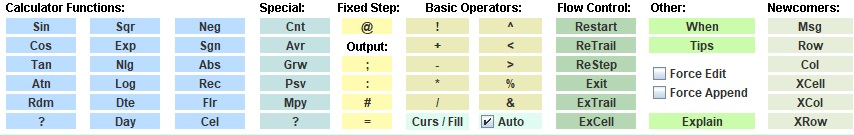
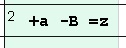
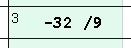
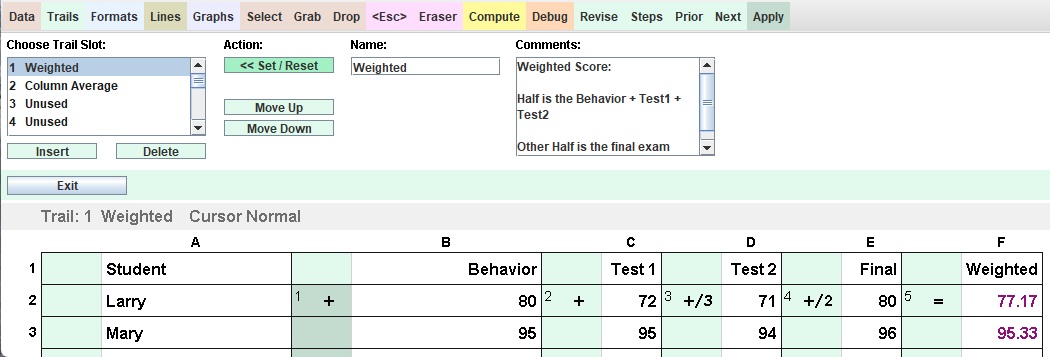
Trails Screen: The Math Lite Toolbar is shown.
2 cells for each column. Green for math. White for text and data.
This solution has been chosen to do the calculation and be illustrative.
Let's introduce some abbreviations:
Cal will be the value in T/Maker's calculator
Adj will be the adjacent value (in the white cell) for the step in question.
iTc will stand for "in This case"

Step 1. An exclamaiton point operator sets Cal to
iTc Adj
Step 2. neg is a function that changes the sign of Cal, iTc negative to positive
Step 3. Cal is divided by iTc Adj
Step 4. Cal is multiplied by 100.
Step 5. Cal is divided by 2 and set to the maximum of itself and 10
Step 6. The equal sign sets iTc Adj equal to Cal and clears Cal to zero

This trail is excuted starting at all darkened green cells beginning with row 3.
These cells were darkend by clicking on the Apply Button and then the cells.


Syntactical Glitch: Do not enter a negative number as an operand.
T/Maker interprets - (dash) as subtraction operator.
Use _ (the underscore character) instead.
Wrong:  *-3  (intended to multiply by -3).  Right:  *_3
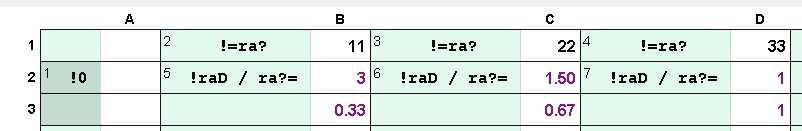
When operators can be followed by an operand but are not,
the corresponding operand is assumed to be the Adj.
This is the case for steps 1, 3, and 6.        

Step 2 is a function that operates on Cal and needs no operand.
Steps 4 and 5 (both of 5's operations) specify constants for the operand.

An operand used in a step can be specified by the letter of its column (case insensitive).
The row is assumed to be the same as the one the step is located on.
The above 6-step process could have been written as just one step and put in any column.
That step is shown below. b, d, and g are the column names used in this example.
This technique often saves time and adds clarity.

Four constants are used.
neg is a function.
There are 5 operators total. All have an operand specified. Thus, no Adj is used as such.

           !b neg  /d  *100   /2   >10  =g

It is amazing what the consequences of these 18 characters have been.


   Dick and Jane Simplicity


If you don't know and don't even want to know how this works?

Many have done well with a blackboard style approach.


The Debugger: A special screen / tool (see below) that
can do all calculations in sequence while you watch.
This is useful for checking your own work, and
also for understanding tables you may have gotten
elsewhere like here!

The table below was created to answer this question:
Can a Cybertruck carry 5,000 cans of sardines without
exceeding its cargo space or cargo weight limit.
It possibly uses more types of operands than you will ever need.
But it covers the most common elements appearing in trails.

With T/Maker the order of every calculation is explicit.
Trails are executed in numerical order.

For each trail, applications are done row by row from the top.
At each row, applications are done left to right.
From each start location, steps are executed in number order.
For each step, the operators are performed left to right.
The debugger begins its display with the trail on the screen.
The usual calculations will have been performed to that point.
The display offers information about the current trail and location.
You will see values and options for how to proceed.

Memories: The trail for this table includes some new elements.
Memories used to store and fetch values can be created on the fly in a step.
Their names must begin with at least two letters. Numbers and letters may follow.
Names are insensitive to case and should be different from any T/Maker keyword.
Memory names may be used as operands just like single letter column names.

In the table below, ms, mw, and cui are memory names.
c and d are column names.
Some steps also use
constants or the Adj as operands.
Intuitive memory names are an excellent place to store intermediate values.

Also new is the # operator. It outputs a value like the equal sign =
but does not clear the calculator to zero.

Debugger Screen Elements:
Upper left corner: details trail, the starting location, and step.

Upper middle: displays previous and current values of cell and calculator.
Upper right area: last operator executed and the next to be executed.
Below that: values of memories and cells recently referenced.
Current step and cell values are boxed on the grid.
The tool bar offers range of options for next advancement.
Choose from next trail, next application, next step, or just the next operator.
A good habit is to walk the debugger through one example of every step.
The Math Explained:
Step 1. Convert space from cubic ft to cubic inches, put in memory ms
Step 2. Convert weight from pounds to ounces, put in memory mw
Step 3. Calculate cubic inches of the sardine tin
Step 4. Put above in memory cui and also in Adj.
Step 5. Enter mw (ounces), divide by ounces of one tin
Step 6. Output maximum tins based on weight to Adj
Step 7. Calculate max tins based on space, output to Adj
Yes on 5,000 tins. Cybertruck could carry around 9500 tins!
Watch the Debugger walk through this table operator by operator. It's an amazing tool for getting stuff right!


Lists: Sometimes a well-made list with a minimum of calculations is valuable on its own. Below is one similar to a favorite of mine. It lists all bills that need to be paid. The list includes the number per year, how it arrives, where to find details about it, what day it closes, how it is paid, an approximate average amount, the total per year (calculated), and a number to sort on for my prefered order. The other number calculated is the column total of "Total." The table can also be sorted on any other column. I print one every three months and use the last three columns to mark an amount paid if any for potentially adjusting the average. With the number of bills one has these days, I am happy to have this page in a permanent location on my phyiscal desktop.


No Overhead: I never hesitate to pull up a new blank trails screen for any math calculation no matter how simple. It takes no longer than picking up a piece of chalk. Typing the numbers and text is, well, typing. Easier is adding the math which is mostly mouse clicks. In ad hoc calculations, I tend to use more trials to keep things flexible. Sadly, you cannot see the changing cursor from clicks on the screen.  Sometimes, I decide to keep what I have by giving it a file name and saving it.

Just Using Trail Screen As A Scratch Pad Video

Even so, I do keep the template below handy without any data. It gives me a head start on adding up lump sums or quantities with unit prices. My once a year hand-prepared maintenance bill for a small ski boat gets checked for labor and parts. The template includes a single pie chart for all the items most of which are zero. I just push the Show button for that.


Mortgages, Etc. :  For mortgage payments and a few other common but complicated calculations, there are built-in procedures to do them. The mortgage payment calculation is the second of the three trails (normally on separate screens shown) below. Memories are filled with the needed data and then the function name is used to do the calculation. You start the specification by clicking on the function name in the Heavy Math Toolbar. You will get cursors to succesively click into the appropriate calculation cells. These cursors already include the needed conversions of the yearly interest rate to monthly rate, and the number of years to the number of months. You only need to do the clicks. In this example, a 30 and a 15 year mortgage using different interest rates are compared.  Watch it happen in a few clicks.


Far Enough?  I think most visitors probably have an inkling at this point whether they would care to give this approach a try or not. You can certainly continue reading or perhaps just taking in the scenery below. In the end, this will be about how you react to a completely new, untried syntax for math calculations. Are you comfortable with it? Does it make you feel confident you have correctly specified the math you wanted? Those questions can only be answered by giving it a try. There is a Download Page link under the greenboard image at the top of this page. Thanks for the time you spent. I hope you found all this somewhat interesting.


Statistics: Basic statistics can be obtianed with one trail using the & (Combo cursor). It uses memories to keep track of a number of key indices. These can be fetched from the memories and displayed as in the table below. With a few other trails you can put the values in normalized form and calculate correlation coefficients. This table includes those calculations. The current maximimum number of rows is 250. I have been meaning to try this with perhaps 25 numbers for each variable and all completely random. I am curious what the chances are of seeing correlation coefficients that suggest a correlation even though all numbers were random.


The When Clause:  Different rows or columns in a table may require very different calculations. With the Apply button you do have the possibility to have a number of different trails and choose to apply them across different rows or columns as needed. This introduces an overhead of keeping track of what is used where and making choices when a new row or column is added.  Another approach is to put something in the trail or a step that lets the trail determine if it should do a calculation or not. This is achieved through what is called a "When Clause."  This clause is a true or false test which can be put in a step. If the clause is true, the operators after it are executed normally. If the clause is false execution moves on to the next step.

The clause itself consists of the word "when," a first operand, a test to be performed, and the second operand for the test. One chooses the elements proceeding from left to right on the help screen. This completes the edit area to the right of the light green "Load Clipboard and Cursor" button below. You may also edit what is in that area to provide specifics of what happens when the test is true. Then you can push the just mentioned button to get a cursor representing the text and click it where needed. It is often the case that some form of almost the same clause is needed more than once. You can change the text in the edit area and use the aforementioned button to get a new cursor. Note below that the calculation given is only executed for rows designated with the code "A".


Watch the construction of a When Clause demonstrating another use of it with the Tally Table button.


Using Cell Names: Cell names are the most common way to reference a value in a standard spreadsheet. Referring to the wrong cell is also probably the most common source of mistakes. T/Maker accepts cell names as operands for operators. The name of a cell is the letter of the column followed by the number of the row (R2, D2, z99). As usual, upper and lower case are not distinguished from each other.

Cell names will not be altered when a trail is reused from other starting points. A cell name in a step will always refer to the same cell. The trail below is applied 12 times
from all locations shown but the same calculation is done everywhere. There can be situations where no shifting of a value or two in a step is indeed the intent.


A cell name in a step, however, will be modified when columns are inserted or deleted to its left. Also, its row number will be changed if rows are inserted or deleted with a lower row number. This adjustment would probably be desired when sections of the whole table are relocated.

For cells that represent global values (e.g.,sales tax) entered in one place and used in many trails, it is generally best to initialize values and place these in memories with intuitive names. This is also an opportunity to convert a value from some natural form (e.g., percentage) to a more useful one (e.g., multiplier rate). See conversion below.


Review of What's What?
  Preloaded Memories (not seen before)


 Trail Functions, Operators, and other items from the Heavy Toolbar


 Types of Operands  - Very important to know by heart and spot immediately which is which.

  
       Adjacent White Cell when operator has none specified. Proximity to the value adds clarity.

 
       Single letter name of a column where the value resides or should go. Saves mentioning a row number. Case insensitive

    
       Constants specified after operator.  Use underscore instead of dash (subtraction) for a negative number in a step, e.g. *_3

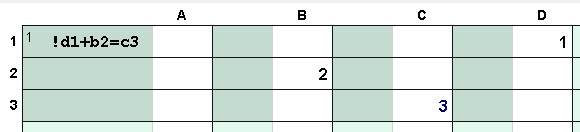
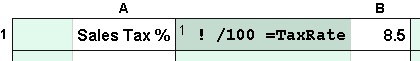
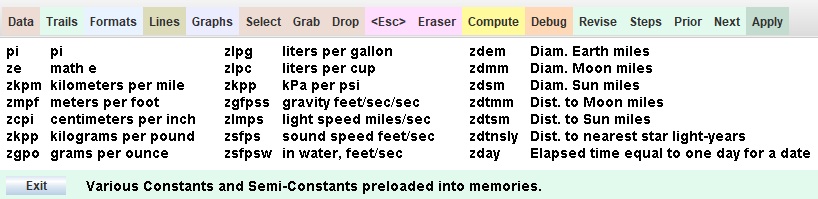
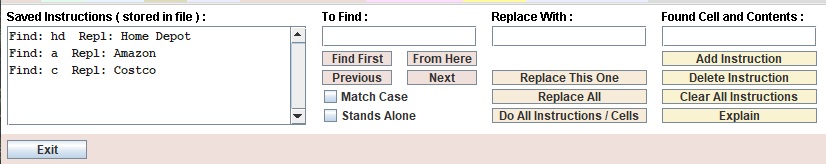
       Memory names must start with 2 letters which can be followed by letters or numbers.
       One letter would be considered column name. Use intuitive names. Case insensitive.

       Cell names use a single letter for the column followed by the row number.  Case insensitive.
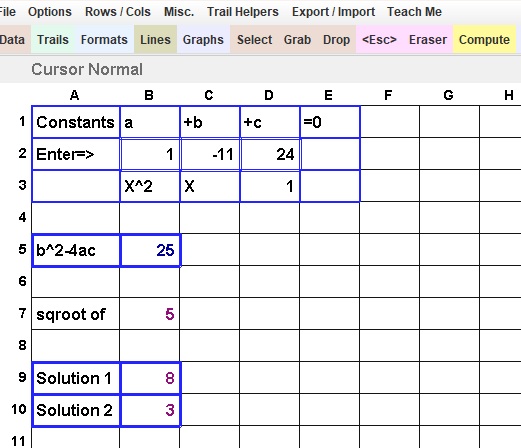
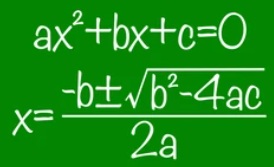
       This is the worst choice with no chance of drawing on something intuitive.  Also, the only way to reference a cell in spreadsheets.

If you are not getting what you think, the debugger will expose how T/Maker is interpreting any operator and operand. You can also develop personal habits
such as starting all memories with a lowercase letter followed by an uppercase letter or even always starting them with the letter M.


Mistakes:

Nobody talks much about mistakes. You are probably not in a position to lose $6.2 billion dollars like "the London Whale" or even the measly sum of $400 million that Lazard threw away with an accidental discount. But whatever you do from planning your allowance and chore income to finding the right down payment and mortgage, you want to be sure that is indeed what you are doing. T/Maker's approach of sequential arithmetic with data and calculations in your face at the same time builds confidence.

 
   Avoids the hidden mistakes in traditional spreadsheets. Use a great special tool to discover and fix the few you do make.


Graphics: While the charts and graphs are not on a par with well-established spreadsheets, you can use them to get insights into your data and a student can learn what type of chart best illustrates a certain point. If you watched the introductary video you saw how effortless it was to specify a chart and its variables.


Printing:  Print the table in one of four fonts. Choose font style and size. Set a row height to tighten or spread out the vertical dimension. Decide whether or not to print lines. Options are available for row headings and column names. Switch between landscape and portrait as well as set margins with two system dialog boxes called up with a button.

The top of the page shows the length and width of your table in pages. In addition to marign adjustments, changing the size of the font and other items may affect these numbers. Use the Recalculate button to refigure the size when you have altered any items. I generally try for a minimum number of pages with the width of only a single page.


Forms: With four different line styles plus the possibility of no line, you can design some nice forms. Allow text to span multiple columns when setting formats (Alignment + Spans). Text can be specified in an invisible ink format effectively blanking it out. This is useful when elements in a table are needed for calculations but not desired in a final print-out.


  Well-rounded to cover basic user needs.


Importing Data:

To try T/Maker, you don't have to start with typing data. You can probably import data from a program you have that exports files in the popular CSV (Comma Seperated Values) format. T/Maker can also import data using white space as a delimiter, parsing mostly vertical columns, or using a first line that is a template for where columns of data are located.


Open a table file or create a new blank one for the data to be imported.
Click Export / Import menu, then Clipboard / File Controls
If the data is in a file, use the Load Clipboard button.
Otherwise make sure the data is in the clipboard.
Push the Show Clipboard button to display the data.
You may edit lines shown for whatever purpose.
If you do, push Set Clipboard To: button to load your edited version.


For this example, I made a selection from a web page and used the copy keystroke. I was unable to select the titles. Perhaps they are represented by a graphic and not text. Pushing the Show Clipboard button, the data appeared as in the listbox. I used the Select cursor on Row 1 Column A as the strarting position to load the table. Then I chose the White Space Delimited option to transfer the data to the table. You can see the first two rows below.


Picking data out of a web page works or does not work depending on how the HTML in the web page is written.
As you can see, there are a number of Clipboard to Table options. You can try one after the other. 
Push the Explain button for more details.

If you can get a CSV file, use it. If not, you can inspect the clipboard to see what might work.  The Export / Import menu also has some cursors to fix problems that might occur on individual rows.


Exporting Data:
Load the table from which data is to be exported.
Click Export / Import menu, then Clipboard / File Controls
Use the Select Cursor to select an area (click first and last cell)
Hint for above: use Page Up, Page Down, etc. to move screen
Or, push Select All button.
Enter CSV Character for separating values in CSV Format.
(Above does not have to be a comma)

Check Export Raw Values or leave blank for formatted values.
Choose a Table to Clipboard option.
Clipboard will then show in area below.
You may edit lines shown for whatever purpose.
If so, push Set Clipboard To: afterwards to load your changes.
To save clipboard as a file, push Save Clipboard option.
A dialog box will allow you to set a folder and file name.
   Moving Data:
   Save the file as it is first. 
Duplicate or move data in a table by exporting it. Then import it to the new location.
   Erase the old data when that operation is completed. Don't save anything until you are sure.
   BTW, one backup file is kept with zzz prepended to the file name if you set that option in the Options Menu.


Find / Replace Helper in Misc. Menu:
To remove unwanted symbols (e.g., $, #) in data obtained elsewhere, this helper screen can save time.
It can also come in handy when entering data. Create abbreviations to minimize typing.
In addition to finding and/or replacing in an ad hoc fashion, you may store a series of replacement instructions with the file itself.
Then the Do All Instructions / Cells button is used to replace all abbreviations with the fully spelled out text.
For a needed monthly list of purchases on behalf of someone else, the previous month's file could be renamed and blanked out to take advantage of the abbreviations stored in it.


     Convenient Tools To Exchange Data with other Programs


  Unorganized (for now) Miscellaneous Topics


It's There Somewhere:  While not always the case, if you find something you and others probably want to do, there is a chance it's there. It may be a faster way to edit, move the screen, duplicate some data, or in this case, insert, delete, or reorder trails and givem the names and descriptions. This starts with the Revise button on the Trails screen. Select the Trail Slot and move it or whatever. If you change the text (Name or Comments), remember to push the Set / Reset button. Names and comments will be helpful reminders. Also, someone else may have put in meaningful text in a file you got from elesewhere, like here! Some other screens have their own purposes for the Revise button.


Column Relative Memory Names:  If a memory name ends with a question mark, the question mark is replaced by the column letter in which the name is used. Again, case insensitive. For Row 1 below the consecutive values are placed in raB, raC, and raD (think of "ra" as an abbreviation for "row above". In the second row, the value in raD (33, the D is specified) is divided by the values above for the three columns which use the question mark. The example below demonstrates how you might put values from previous rows into memories to make referencing them easier without having to use cell names. Note that when calculating row 3, the row above becomes row 2.
This is not often used but can prove valuable.


The Quadratic:  Real life math is generally about applying known formulas to known values to get an estimate or understanding. Finding solutions to equations or points where lines intersect is more about scientific pursuit than managing your home or even small business.  Part of algebra includes this famous formula which can be a nightmare for some students. I thought I would put in a table that solves it for the coefficients a, b, and c.  Pushing the Compute button displays the solution if there is one in real numbers and prepares a list of numbers for the chart to the right. The Show button would show the chart.


The necessary designations for the graph values were put in the table manually on the Graphs input page.  I first did the graph as a single line showing the parabola f(x) versus x. That was rather boring and quite low on information value. I then tried the presentation above. The value of x is shown as a red bar which starts off negative and climbs. The blue bar shows the value of the function. You can see the two solutions where the height of the blue bar is zero. When things are easy, a spirit of trial and error discovery is encouraged. That often leads to something unexpected and better.


Toy or No Toy?  If you have not yet guessed it, I enjoy math and sometimes use my freetime with T/Maker to investigate an issue that triggers my curiosity. A number of capabilities in T/Maker (some still to see) would not be there if I were only trying to satisfy the demands of the most common denominator of a user. They are included to allow myself and others like me to solve problems from a wide spectrum including some that require simulations. This is an example of one of those.

Roulette:The table below gambles on roulette with the optimal strategy. One sets what they are willing to risk and how much they want to win. You choose your lucky number as well! The strategy involves betting only on a single number with an amount that achieves your goal on your first win. That amount goes up to cover bets lost. The more you are willing risk for a smaller win, the better your chances. To avoid being responsible for a bad decision you might make, the example below of risking 10,000 to win 500 actually loses after 108 lost bets in row. It wins much more often than it loses. But a loss wipes out the gain from 20 wins.

This simulation is done in one trail so it could be shown one screen. Dividing tasks into a few trails be more natural. You can think of the trail as a program that runs over and over again until either the number of passes exceeds "Max Passes," the money is all lost, or the desired winnings are achieved.  Steps 1 to 4 initialize values in memories for the very first pass. Steps 5 through 8 place the remianing funds, update the number of passes, and check for a terminal condition. Steps 9 and 10 calculate the bet ("cel" stands for ceiling and forces the bet, if possible, to be the whole number big enough to achieve the desired winnings). Step 11 rolls the dice. Step 12 handles a losing bet. Step 13 handles a winning bet. In either case, the trail is restarted which would exit if a terminal condition has arrived. At the top of the screen is the "heavy" math toolbar to remind you of what's available.

Why is this the optimal strategy? Like all casino games, the odds favor the house. When you bet on more that one number, part of your bet is actually betting against other parts of your bet. The more money that gets to the table, the more slices of it the house is expected to get. The odds pay you as though there were 36 numbers on the wheel but there are 38 when you include 0 and 00.


Here's a video of a number of spins. Watch the Pass count and the This Bet size.