Importing Data:
To
try T/Maker, you don't have to start with typing data. You can probably
import data from a program you have that exports files in the popular
CSV (Comma Seperated Values) format. T/Maker can also import data using
white space as a delimiter, parsing mostly vertical columns, or using a
first line that is a template for where columns of data are located.

Open a table file or create a new blank one for the data to be imported.
Click Export / Import menu, then Clipboard / File Controls
If the data is in a file, use the Load Clipboard button.
Otherwise make sure the data is in the clipboard.
Push the Show Clipboard button to display the data.
You may edit lines shown for whatever purpose.
If you do, push Set Clipboard To: button to load your edited version.
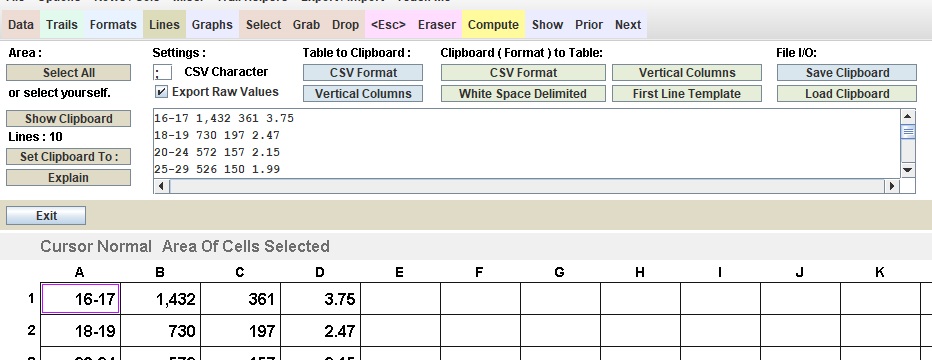
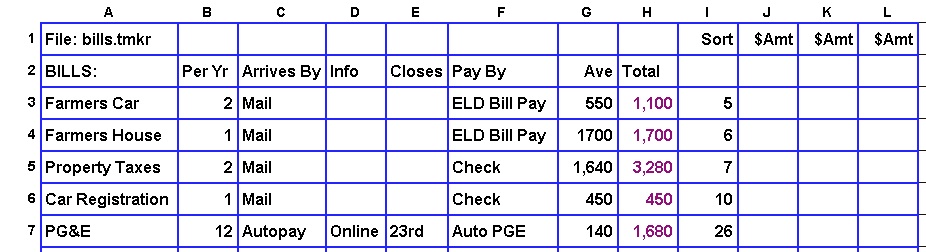
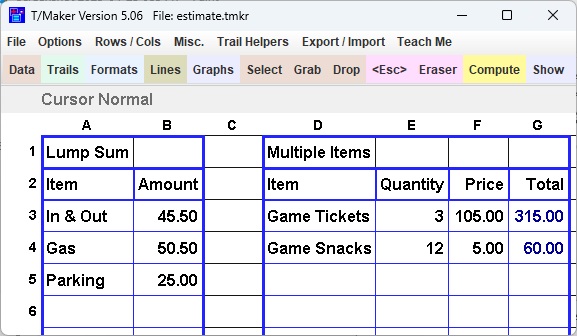
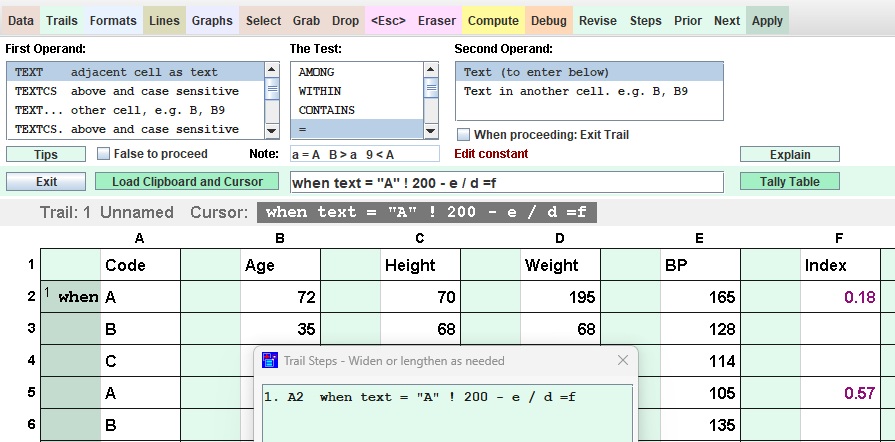
For
this example, I made a selection from a web page and used the copy
keystroke. I was unable to select the titles. Perhaps they are
represented by a graphic and not text. Pushing the Show Clipboard
button, the data appeared as in the listbox. I used the Select cursor
on Row 1 Column A as the strarting position to load the table. Then I
chose the White Space Delimited option to transfer the data to the
table. You can see the first two rows below.
|

Picking data out of a web page works or does not work depending on how the HTML in the web page is written.
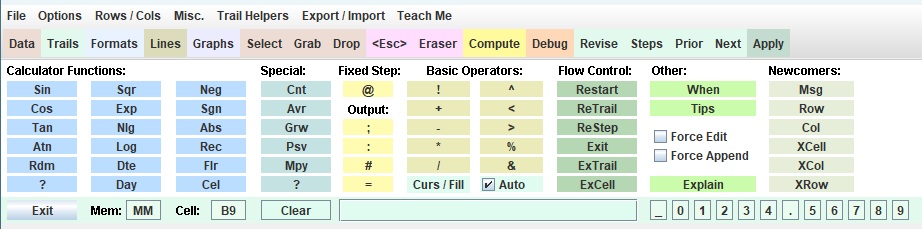
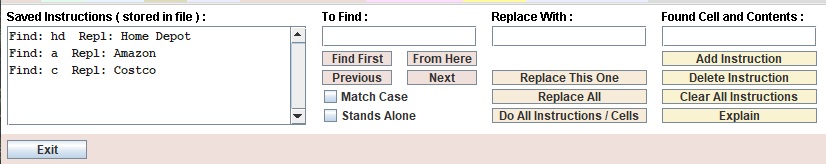
As you can see, there are a number of Clipboard to Table options. You can try one after the other.
Push the Explain button for more details.
If you can get a CSV file, use it. If not, you can inspect the
clipboard to see what might work. The Export / Import menu also
has some cursors to fix problems that might occur on individual rows. |
Exporting Data:
Load the table from which data is to be exported.
Click Export / Import menu, then Clipboard / File Controls
Use the Select Cursor to select an area (click first and last cell)
Hint for above: use Page Up, Page Down, etc. to move screen
Or, push Select All button.
Enter CSV Character for separating values in CSV Format.
(Above does not have to be a comma)
|
Check Export Raw Values or leave blank for formatted values.
Choose a Table to Clipboard option.
Clipboard will then show in area below.
You may edit lines shown for whatever purpose.
If so, push Set Clipboard To: afterwards to load your changes.
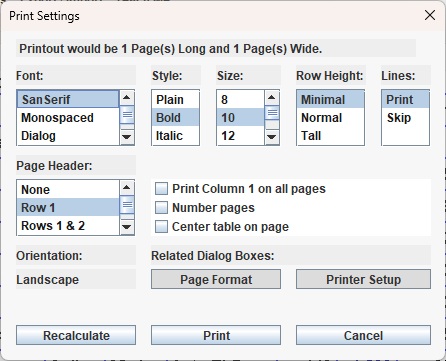
To save clipboard as a file, push Save Clipboard option.
A dialog box will allow you to set a folder and file name. |
Moving Data:
Save the file as it is first. Duplicate or move data in a table by exporting it. Then import it to the new location.
Erase the old data when that operation is completed. Don't save anything until you are sure.
BTW, one backup file is kept with zzz prepended to the file name if you set that option in the Options Menu.
|

 Related History: This product has roots in one I created in 1979 and a modernization of the most unusual part in 1991. In 2020 a Windows
update sacrificed these items. Given my history, I
was not about to jump ship to a normal spreadsheet. That would be a
betrayal of decades of ideas, fond memories, and a surprising level of
success. So I decided to resurrect and revamp the calculating syntax that has remained unique, but to do it better for a
different underlying purpose. Programming was done in Oracle's java language to cover Windows, Macs, and some other machines.
Related History: This product has roots in one I created in 1979 and a modernization of the most unusual part in 1991. In 2020 a Windows
update sacrificed these items. Given my history, I
was not about to jump ship to a normal spreadsheet. That would be a
betrayal of decades of ideas, fond memories, and a surprising level of
success. So I decided to resurrect and revamp the calculating syntax that has remained unique, but to do it better for a
different underlying purpose. Programming was done in Oracle's java language to cover Windows, Macs, and some other machines.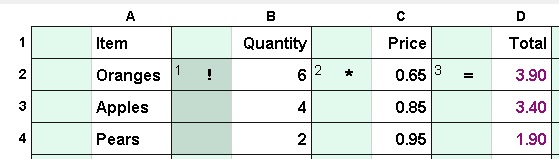
 It's not even possible to make


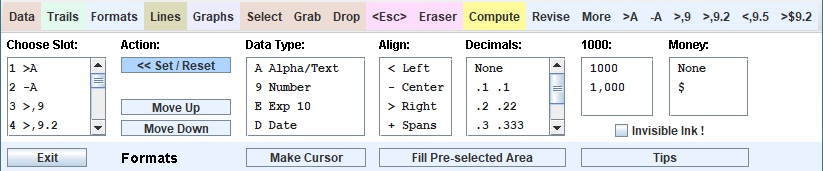
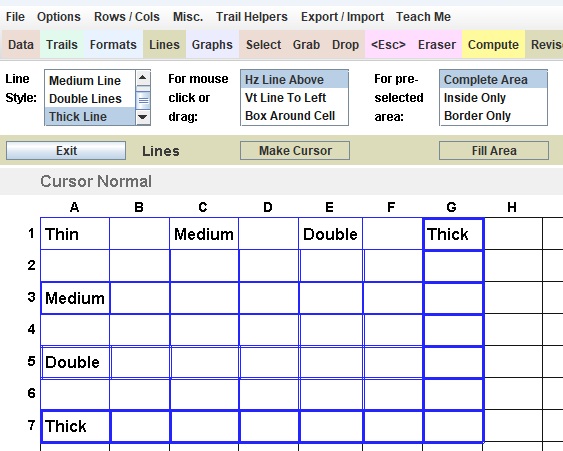
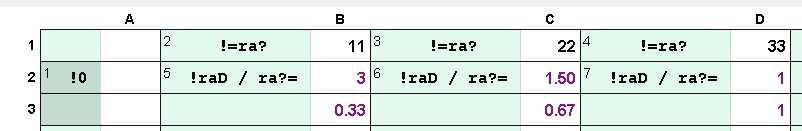
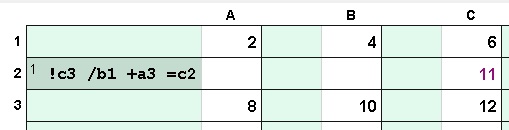 Cell Names: Cell
names are generally used in all commercial spreadsheets as the way to
identify values needed in a formula. In T/Maker one tries to avoid them
as they are often the cause of mistakes. But you can use them. The name
of an individual
cell is the column name letter followed by the row number. Note the in the
example that the step could be placed in any cell and would accomplish the
exact same calculation.
Cell Names: Cell
names are generally used in all commercial spreadsheets as the way to
identify values needed in a formula. In T/Maker one tries to avoid them
as they are often the cause of mistakes. But you can use them. The name
of an individual
cell is the column name letter followed by the row number. Note the in the
example that the step could be placed in any cell and would accomplish the
exact same calculation. 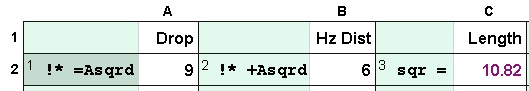 Memory Names:


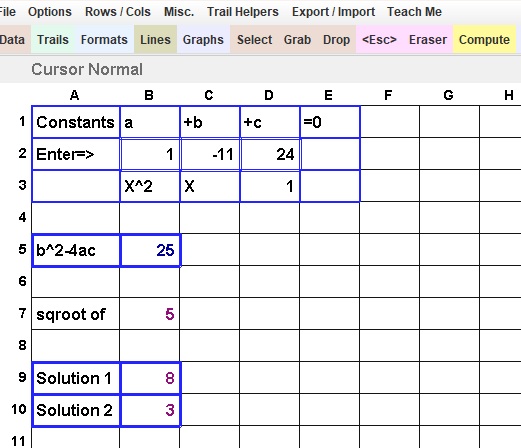
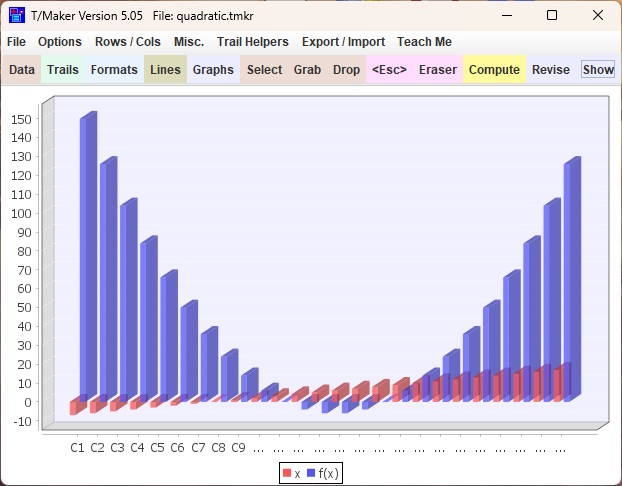
 The Quadratic: